Ready Or Not… The unsustainable status quo is ending

images

By Chris Martenson

Source: Peak Prosperity

I have to confess, it’s getting more and more difficult to find ways of writing about everything going on in the world.

Not because there’s a shortage of things to write about — wars, propaganda, fraud, Ebola — but because most of the negative news and major world events we see around us are symptoms of the disease, not the disease itself.

There are only so many times you can describe the disease, before it all becomes repetitive for both the writer and the reader. It’s far more interesting to get to the root cause, because then real solutions offering real progress can be explored.

Equally troubling, in a world where the central banks have distorted, if not utterly flattened, the all important relationship between prices, risk, and reality, what good does it do to seek some sort of meaning in the new temporary arrangement of things?

When the price of money itself is distorted, then all prices are merely derivative works of that primary distortion. Some prices will be too high, some far too low, but none accurately determined by the intersection of true demand and supply.

If risk has been taken from where it belongs and instead shuffled onto central bank balance sheets, or allowed to be hidden by new and accommodating accounting tricks, has it really disappeared? In my world, risk is like energy: it can neither be created nor destroyed, only transformed or transferred.

If reality no longer has a place at the table — such as when policy makers act as if the all-too-temporary shale oil bonanza is now a new permanent constant — then the discussions happening around that table are only accidentally useful, if ever, and always delusional.

Through all of this, the big picture as described in the Crash Course grows ever more obviously clear: we are on an unsustainable course; economically, ecologically, and — most immediately worryingly  — in our use of energy.

So let’s start there, with a simple grounding in the facts.

By The Numbers

Humans now number 7.1 billion on the planet and that number is on track to rise to 8 or 9 billion by 2050. Already ‘energy per capita’ is stagnant across the world and has been for a few decades. If the human population indeed grows by 15-25% over the next three and a half decades, then net energy production will have to grow by the same amount simply to remain constant on a per capita basis.

But can it? Specifically, can the net energy we derive from oil grow by another 15% to 25% from here?

Consider that, according to the EIA, the US shale oil miracle will be thirty years in the rear-view mirror by 2050 (currently projected to peak in 2020). And beyond just shale, all of the currently-operating conventional oil reservoirs will be far past peak and well into their decline. That means that the energy-rich oil from the giant fields of yesteryear will have to be replaced by an even larger volume of new oil from the energetically weaker unconventional plays just to hold things steady.

To advance oil net energy on a per capita basis between now and 2050, we’ll have to fight all of the forces of depletion with one hand, and somehow generate even more energy output from energetically parsimonious unconventional sources such as shale and tar sands with the other hand.

These new finds…they just aren’t the same as the old ones. They are deeper, require more effort per well to get oil out, and return far less per well than those of yesteryear. Those are just the facts as we now know them to be.

In 2013, total worldwide oil discoveries were just 20 billion barrels. That’s against a backdrop of 32 billion barrels of oil production and consumption. Since 1984, consuming more oil than we’re discovering has been a yearly ritual. To use an analogy: it’s as if we’re spending from a trust fund at a faster rate than the interest and dividends are accruing. Eventually, you eat through the principal balance and then it’s game over.

Meanwhile, even as the total net energy we receive from oil slips and our consumption wildly surpasses discoveries, the collective debt of the developed economies has surpassed the $100 trillion mark — which is a colossal bet that the future economy will not only be larger than it is currently, but exponentially larger.

These debts are showing no signs of slowing down. Indeed, the world’s central banks are doing everything in their considerable monetary power to goose them higher, even if this means printing money out of thin air and buying the debt themselves.

Along with this, the demographics of most developed economies will be drawing upon badly-underfunded pension and entitlement accounts — most of which are literally nothing more substantial than empty political promises made many years ago.

These trends in oil, debt and demographics are stark facts all on their own. But when we tie these to the obvious ecological strains of meeting the needs of just the world’s current 7.1 billion, any adherence to the status quo seems worse than merely delusional.

Here’s just one example from the ecological sphere. All over the globe we see regions in which ancient groundwater, in the form of underground aquifers, is being tapped to meet the local demand.

Many of these reservoirs have natural recharge rates that are measured in thousands, or even tens of thousands, of years.

Virtually all of them are being over-pumped. The ground water is being removed at a far faster rate than it naturally replenishes.

This math is simple. Each time an aquifer is over-pumped, the length of time left for that aquifer to serve human needs diminishes. Easy, simple math. Very direct.

And yet, we see cultures all over the globe continuing to build populations and living centers – very expensive investments, both economically and energetically – that are dependent for their food and water on these same over-pumped aquifers.

In most cases, you can calculate with excellent precision when those aquifers will be entirely gone and how many millions of people will be drastically impacted.

And yet, in virtually every case, the local ‘plan’ (if that’s the correct word to use here) is to use the underground water to foster additional economic/population growth today without any clear idea of what to do later on.

The ‘plan’ such as it is, seems to be to let the people of the future deal with the consequences of today’s decisions.

So if human organizations all over the globe seem unable to grasp the urgent significance of drawing down their water supplies to the point that they someday run out, what are the odds we’ll successfully address the more complex and less direct impacts like slowly falling net energy from oil, or steadily rising levels of debt? Pretty low, in my estimation.

Conclusion

Look, it’s really this simple: Anything that can’t go on forever, won’t.  We know, financially speaking, that a great number of nations are utterly insolvent no matter how much the accounting is distorted. Said another way: there’s really no point in worrying about the combined $100 trillion shortfall in Social Security and Medicare, because it simply won’t be paid.

Why? It can’t, so it won’t. The promised entitlements dwarf our ability to fund them many times over. There’s really not much more to say there.

But the biggest predicament we face is that steadily-eroding net energy from oil, which will someday be married to steadily-falling output as well, can’t support billions more people and our steadily growing pile of debt.

Just as there’s no plan at all for what to do when the groundwater runs out besides ‘Let the folks in the future figure that one out,’ there’s no plan at all for reconciling the forced continuation of borrowing at a faster rate than the economy can (or likely will be able to) grow.

The phrase that comes to mind is ‘winging it.’

The wonder of it all is that people still turn to the same trusted sources for guidance and as a place to put their trust. For myself, I have absolutely no faith that the mix of DC career politicians and academic wonks in the Fed have any clue at all about such things as energy or ecological realities.  Their lens only concerns itself with money, and the only tradeoff concessions they make are between various forms of economic vs. political power.

If the captains supposed to be guiding this ship are using charts that ignore what lies beneath the waterline, then you can be sure that sooner or later the ship is going to strike something hard and founder.

I’m pretty sure the Fed’s (and ECB’s and BoJ’s and BoE’s) charts resemble those of medieval times, with “Here be dragons” scrawled in the margins next to a series of charts of falling stock prices and unwinding consumer debt.

So there we are. The globe is heading from 7.1 billion to 8 or 9 billion souls, during a period of time when literally every known oil find will be well past its peak. Perhaps additional shale finds will come along on other continents to smooth things out for a bit (which is not looking likely), but it’s well past time to square up to the notion that cheap oil is gone. And with it, our prospects for the robust and widespread prosperity of times past.

Growing Social Inequality in America. Wealth Concentration and Decline in Living Standards

inequality-illo

New Federal Reserve report US median income has plunged, inequality has grown in Obama “recovery”

By Andre Damon

Source: Global Research

The yearly income of a typical US household dropped by a massive 12 percent, or $6,400, in the six years between 2007 and 2013. This is just one of the findings of the 2013 Federal Reserve Survey of Consumer Finances released Thursday, which documents a sharp decline in working class living standards and a further concentration of wealth in the hands of the rich and the super-rich.

The report makes clear that the drop in a typical household’s income was not merely the result of what is referred to as the 2008 recession, which officially lasted only 18 months, through June 2009. Much of the decline in workers’ incomes occurred during the so-called “economic recovery” presided over by the Obama administration.

In the three years between 2010 and 2013, the annual income of a typical household actually fell by 5 percent.

household_income

Reserve Survey of Consumer Finances

The Fed report exposes as a fraud the efforts of the Obama administration to present itself as a defender of the “middle class”. It has systematically pursued policies to redistribute wealth from the bottom to the very top of the income ladder. These include the multi-trillion-dollar bailout of the banks, near-zero interest rates to drive up the stock market, and austerity measures and wage cutting to lift corporate profits and CEO pay to record highs.

The Federal Reserve data, based on in-person interviews, show a far larger decline in the median income of American households than indicated by earlier figures from the Census Bureau’s Current Population Survey.

In line with the figures on household income, the report shows an ever-growing concentration of wealth among the richest households. The Fed’s summary of its data notes that “the wealth share of the top 3 percent climbed from 44.8 percent in 1989 to 51.8 percent in 2007 and 54.4 percent in 2013,” while the wealth of the “next 7 highest percent of families changed very little.”

The report states that “the rising wealth share of the top 3 percent of families is mirrored by the declining share of wealth held by the bottom 90 percent,” which fell from 33.2 percent in 1989 to 24.7 percent in 2013.

income_shares

Reserve Survey of Consumer Finances

The ongoing impoverishment of the population is an indictment of capitalism. There has been no genuine recovery from the Wall Street crash of 2008, only a further plundering of the economy by the financial aristocracy. The crisis precipitated by the rapacious, criminal practices of the bankers and hedge fund speculators has been used to restructure the economy to the benefit of the rich at the expense of everyone else.

Decent-paying jobs have been wiped out and replaced by low-wage, part-time and temporary jobs, with little or no benefits. Pensions and health benefits have come under savage attack, as seen in the bankruptcy of Detroit.

Not surprisingly, the Fed report has been buried by the American media, confined to the inside pages of the major newspapers.

Measured in 2013 dollars, a typical household received an income of $53,100 in 2007. By 2010, this had fallen to $49,000. It hit $46,700 by 2013. At the same time, the average income for the wealthiest tenth of families grew by ten percent.

While median income fell between 2010 and 2013, mean (average) income grew, from $84,100 to $87,200. The report noted that, “the decline in median income coupled with the rise in mean income is consistent with a widening income distribution during this period.”

For the poorest households, the drop in income has been even more dramatic. Among the bottom quarter of households, mean income fell a full 10 percent between 2010 and 2013.

The report reveals other aspects of the social crisis. The share of young families burdened by education debt nearly doubled, from 22.4 percent to 38.8 percent, between 2001 and 2013. The share of young families with more than $100,000 in debt has grown nearly tenfold, from 0.6 percent to 5.6 percent.

These statistics reflect both a historic and insoluble crisis of the profit system and the brutal policies of the American ruling class, which is carrying out a relentless assault on working people and preparing to go even further by dismantling bedrock social programs such as Medicare and Social Security. The data undercuts the endless talk of “partisan gridlock” in Washington and the media presentation of a political system paralyzed by irreconcilable differences between the Democratic and Republican parties.

There has, in fact, been a seamless continuity between the Bush and Obama administrations in the pursuit of reactionary policies of war abroad and class war at home. The two parties have worked hand in glove to make the working class pay for the crisis of the capitalist system.

The Federal Reserve has itself played a critical role in the growth of social inequality in the US. The bailout of the banks, estimated at $7 trillion, has been followed by six years of virtually free money for the banks.

Every facet of American life is dominated by the immense concentration of wealth at the very top of society. The grotesque levels of wealth amassed by the parasites and criminals who dominate American business, and the flaunting of their fortunes before tens of millions struggling to pay their bills and keep from falling into destitution, are fueling the growth of social anger. This anger will increasingly be directed against the entire economic and political system.

The figures released by the Fed reflect a society riven by class divisions that must inevitably trigger social upheavals. The explosive state of social relations is itself a major factor in the endless recourse by the Obama administration to military aggression and war, which serve to deflect internal tensions outward.

The growth of inequality likewise underlies the relentless attack on democratic rights in the US, including the massive domestic spying exposed by Edward Snowden and the use of militarized police to crack down on social opposition, as seen most recently in Ferguson, Missouri.

The Economics Of Marriage

rings

Michael Snyder recently wrote an interesting analysis of the relationship between the declining economy and the declining state of marriage in the U.S. While I share much of the same concerns my perspective is different in certain respects. For example, I do not share the same alarm Snyder has regarding the trend of unmarried couples cohabitating. In some cases it’s preferable to living alone and can provide an equivalent sense of interpersonal support as marriage on a day to day level. However, I would agree that the institution of marriage has a generally positive impact on social and domestic cohesion (though it’s unfortunate that the state gets involved for tax purposes or when incompatible couples are pressured to stay married for reasons of religion or tradition).

Another point of disagreement is regarding the declining rate of childbirth. If humanity (especially the governments and corporations it creates) continues to consume, pollute and wage wars at the current rate, a voluntary reduction in birth rate may ethically create the needed time to change or reverse such trends before they cause a mass die-off. Child-free adults also have more potential to keep up with current events and be politically active. Snyder rightfully points out that the current economic structure is destroying jobs but failed to mention that with increased technology and automation, the fact is that less workers are needed in modern societies. The choice of not having children can be seen as an adaptation to current economic reality. So how will we survive as an aging majority population? Probably with the help of technology and the children of immigrants.


The Economics Of Marriage

By Michael Snyder

Source: Investment Watch

According to a startling new study conducted at Bowling Green University, the marriage rate in America has fallen precipitously over the past 100 years.

In 1920, there were 92.3 marriages for every 1,000 unmarried women.  In 2012, there were only 31.1 marriages for every 1,000 unmarried women.

That is not just a new all-time low, that is a colossal demographic earthquake.

That same study found that the marriage rate has fallen by an astounding60 percent since 1970 alone.

As a result, U.S. households look far different today than they once did.

Back in 1950, 78 percent of all households in the U.S. contained a married couple.  Today, that number has declined to 48 percent.

That is a very troubling sign if you consider the family to be one of the fundamental building blocks of society.

When young people are asked why they are delaying marriage today, one of the things that always seems to get brought up is money.  There is a feeling (especially among men) that you should achieve a certain level of financial security before making the big plunge.

And it is a fact that the more money you have, the more likely you are to be married.  Just check out the following stats about income and marriage from a recent Business Insider article

83% of 30- to 50-year-old men in the top 10% of annual earnings are married today, whereas only 64% of median earners and half of those in the bottom 25th percentile are hitched.

Now, compare that to men in 1970, whose marriage rates were 95% (top earners), 91% (median earners), and 60% (bottom 25th percentile of earners), respectively.

A lot of people like to think that “love is the only thing that matters” when it comes to marriage, but the cold, hard numbers tell a different story.  In fact, one very shocking survey discovered that 75 percent of all American women would have a problem even dating an unemployed man…

Of the 925 single women surveyed, 75 percent said they’d have a problem with dating someone without a job. Only 4 percent of respondents asked whether they would go out with an unemployed man answered “of course.”

“Not having a job will definitely make it harder for men to date someone they don’t already know,” Irene LaCota, a spokesperson for It’s Just Lunch, said in a press release. “This is the rare area, compared to other topics we’ve done surveys on, where women’s old-fashioned beliefs about sex roles seem to apply.”

Unfortunately for American men, there simply are not enough good jobs to go around.  In fact, the number of working age Americans without a job has increased by 27 million since the year 2000, and businesses in the U.S. are being destroyed faster than they are being created.

Due to a lack of economic opportunities, a rising percentage of our young people have been giving up on the “real world” and have been moving back in with Mom and Dad.  For much more on this, please see my previous article entitled “29 Percent Of All U.S. Adults Under The Age Of 35 Are Living With Their Parents“.  And when you break down the numbers, you find that young men are almost twice as likely to move back in with their parents as young women are.

But economic factors alone certainly do not account for the tremendous decline in the marriage rate that we have witnessed in this country.  Shifting cultural attitudes also play a huge role.

A whole host of opinion polls and surveys show that Americans simply do not value marriage and having children as much as they once did.  For example, the Pew Research Center has found that the younger you are, the more likely you are to believe that “marriage is becoming obsolete” and that “children don’t need a mother and a father to grow up happily”.

In fact, an astounding 44 percent of all Americans in the 18 to 29-year-old age bracket now believe that “marriage is becoming obsolete”.

And why should they get married?  Our movies and television shows constantly tell them that they can have the benefits of being married without ever having to make a lifelong commitment.

This sounds particularly good to men, since they can run around and have sex with lots of different women without ever having to “settle down”.

But there are most definitely consequences for this behavior.  The “sexual revolution” has left behind countless broken hearts, shattered dreams, unintended pregnancies and devastated families.

In addition, the U.S. has become a world leader when it comes to sexually-transmitted disease.

It is hard to believe this number, but according to the Centers for Disease Control and Prevention approximately one-third of the entire population of the United States (110 million people) currently has a sexually transmitted disease.

So nobody should claim that the “sexual revolution” has not had any consequences.

But most Americans don’t actually run around and sleep with lots of different people at the same time.  Instead, most Americans seem to have adopted a form of “serial monogamy“.

In America today, most people only sleep with one person at a time, and “living together” is being called “the new marriage”.

According to the CDC, 74 percent of all 30-year-old women in the U.S. say that they have cohabitated with a romantic partner without being married to them, and it has been estimated that 65 percent of all couples that get married in the United States live together first.

Many believe that by “trying out” the other person first that it will give them a much better chance of making marriage work if they eventually do choose to go down that path.  Unfortunately, that does not seem to work out very well in practice.  In fact, the divorce rate for couples that live together first is significantly higher than for those that do not.

And when it comes to divorce, America is the king.

For years, the U.S. has had the highest divorce rate in the developed world.

But it wasn’t always this way.  Back in 1920, less than one percent of all women in the United States were currently divorced or separated.  Today, approximately 15 percent of all women in the United States are currently divorced or separated.

So why are so many people getting divorced?

Of course there are a lot of factors involved (including money), but a big one is cheating.  According to one survey, 41 percent of all spouses admit to infidelity.  Many Americans simply find it very difficult to stay committed to one person for an extended period of time.

As a result of what I have discussed so far, it is easy to see why people in our society are so lonely and so isolated.  Less people are getting married, more divorces are happening and couples are having fewer children.  This means that our households are smaller and we have far fewer family connections than we once did.

100 years ago, 4.52 people were living in the average U.S. household, but now the average U.S. household only consists of 2.59 people.

That is an astounding figure.

And the United States has the highest percentage of one person households on the entire planet.

But we weren’t meant to live alone.  We were meant to love and to be loved.

Often, those that are being hurt the most by our choices as a society are the children.  They need strong, stable homes to grow up in, and we are not providing that for millions upon millions of them.

When you look at just women under the age of 30 in the United States,more than half of all babies are being born out of wedlock.

That would have been unimaginable 100 years ago.

And of course when there is no marriage involved, a lot of times the guy does not stick around.  At this point, approximately one out of every three children in the United States lives in a home without a father, and in many impoverished areas of the country the rate is well over 50 percent.

In addition, women are waiting much longer to have children than they once did.

In 1970, the average woman had her first child when she was 21.4 years old.  Now the average woman has her first child when she is 25.6 years old.

The biggest reason for this, once again, is money

In the United States, three-quarters of people surveyed by Gallup last year said the main reason couples weren’t having more children was a lack of money or fear of the economy.

The trend emerges as a key gauge of future economic health — the growth in the pool of potential workers, ages 20-64 — is signaling trouble ahead. This labor pool had expanded for decades, thanks to the vast generation of baby boomers. Now the boomers are retiring, and there are barely enough new workers to replace them, let alone add to their numbers.

We are waiting longer to have children and having fewer of them, but those children are needed for the economic future of this country.

Fifteen years from now, one out of every five Americans will be over the age of 65.  All of those elderly Americans are going to want the rest of us to keep the financial promises that were made to them.  But that is going to turn out to be quite impossible.  We simply do not have enough people.

In the end, the economics of marriage does not just affect those that are thinking of getting married or those that are already married.

The truth is that the economics of marriage affects all of us.

Mainstream Economics Warns Out-of-Control Inequality Harms the Economy…But Corrupt Government Policy Keeps Increasing Inequality

land grap

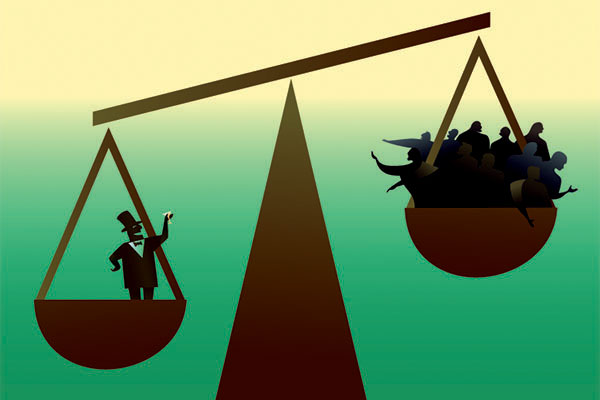
Who’s Who of Prominent Economists Agree: Inequality Harms Economic Growth

By WashingtonsBlog

A who’s who of prominent liberal and conservative economists in government and academia have now said that runaway inequality harms economic growth, including:

  • Former U.S. Secretary of Labor and UC Berkeley professor Robert Reich
  • Global economy and development division director at Brookings and former economy minister for Turkey, Kemal Dervi
  • Societe Generale investment strategist and former economist for the Bank of England, Albert Edwards
  • Michael Niemira, chief economist at the International Council of Shopping Centers
  • Former executive director of the Joint Economic Committee of Congress, senior policy analyst in the White House Office of Policy Development, and deputy assistant secretary for economic policy at the Treasury Department, Bruce Bartlett
  • Deputy Division Chief of the Modeling Unit in the Research Department of the IMF, Michael Kumhof

Even the father of free market economics – Adam Smith – didn’t believe that inequality should be a taboo subject.

Numerous investors and entrepreneurs agree that runaway inequality hurts the economy, including:

How Bad Is It?

So how bad is it, really?

Inequality in America today is twice as bad as in ancient Rome, worse than it was in Tsarist Russia, Gilded Age America, modern Egypt, Tunisia or Yemen, many banana republics in Latin America, and worse than experienced by slaves in 1774 colonial America. (More stunning facts.)

It’s Not an Accident … It’s Policy

Extreme inequality helped cause the Great Depression, the current financial crisis … and the fall of the Roman Empire . Bad government policy – which favors the fatcats at the expense of the average American – is largely responsible for our runaway inequality.

And yet the powers-that-be in Washington and Wall Street are accelerating the redistribution of wealth from the lower, middle and more modest members of the upper classes to the super-elite.

Defenders of the status quo pretend that this inequality is something outside of our control … like a force of nature. They argue that it’s due to technological innovation or something else outside of policy-makers’ control.

In reality, inequality is rising due to bad policy.

Nobel prize winning economist Joe Stiglitz said recently:

Inequality is not inevitable. It is not … like the weather, something that just happens to us. It is not the result of the laws of nature or the laws of economics. Rather, it is something that we create, by our policies, by what we do.

We created this inequality—chose it, really—with [bad] laws …

Gaming the System to Pillage and Loot

The world’s top economic leaders have said for years that inequality is spiraling out of control and needs to be reduced. Why is inequality soaring even though world economic leaders have talked for years about the urgent need to reduce it?

Because they’re saying one thing but doing something very different. And both mainstream Democrats and mainstream Republicans are using smoke and mirrors to hide what’s really going on.

And it’s not surprising … Nobel winner Stiglitz says that inequality is caused by the use of money to shape government policies to benefit those with money. As Wikipedia notes:

A better explainer of growing inequality, according to Stiglitz, is the use of political power generated by wealth by certain groups to shape government policies financially beneficial to them. This process, known to economists as rent-seeking, brings income not from creation of wealth but from “grabbing a larger share of the wealth that would otherwise have been produced without their effort”

Rent seeking is often thought to be the province of societies with weak institutions and weak rule of law, but Stiglitz believes there is no shortage of it in developed societies such as the United States. Examples of rent seeking leading to inequality include

  • the obtaining of public resources by “rent-collectors” at below market prices (such as granting public land to railroads, or selling mineral resources for a nominal price in the US),
  • selling services and products to the public at above market prices (medicare drug benefit in the US that prohibits government from negotiating prices of drugs with the drug companies, costing the US government an estimated $50 billion or more per year),
  • securing government tolerance of monopoly power (The richest person in the world in 2011, Carlos Slim, controlled Mexico’s newly privatized telecommunication industry).

(Background here, here and here.)

Stiglitz says:

One big part of the reason we have so much inequality is that the top 1 percent want it that way. The most obvious example involves tax policy …. Monopolies and near monopolies have always been a source of economic power—from John D. Rockefeller at the beginning of the last century to Bill Gates at the end. Lax enforcement of anti-trust laws, especially during Republican administrations, has been a godsend to the top 1 percent. Much of today’s inequality is due to manipulation of the financial system, enabled by changes in the rules that have been bought and paid for by the financial industry itself—one of its best investments ever. The government lent money to financial institutions at close to 0 percent interest and provided generous bailouts on favorable terms when all else failed. Regulators turned a blind eye to a lack of transparency and to conflicts of interest.

***

Wealth begets power, which begets more wealth …. Virtually all U.S. senators, and most of the representatives in the House, are members of the top 1 percent when they arrive, are kept in office by money from the top 1 percent, and know that if they serve the top 1 percent well they will be rewarded by the top 1 percent when they leave office. By and large, the key executive-branch policymakers on trade and economic policy also come from the top 1 percent. When pharmaceutical companies receive a trillion-dollar gift—through legislation prohibiting the government, the largest buyer of drugs, from bargaining over price—it should not come as cause for wonder. It should not make jaws drop that a tax bill cannot emerge from Congress unless big tax cuts are put in place for the wealthy. Given the power of the top 1 percent, this is the way you would expect the system to work.

Former Sectretary of Labor Robert Reich recently noted:

When so much wealth accumulates at the top, with money comes the capacity to control politics… It’s not that people are rich, it’s that they abuse their wealth … The wealthy contribute to political candidates and the access that their contributions buy entrenches inequality by securing subsidies, bailouts and policies that lead to even greater inequality.

Bloomberg reports:

The financial industry spends hundreds of millions of dollars every election cycle on campaign donations and lobbying, much of which is aimed at maintaining the subsidy [to the banks by the public]. The result is a bloated financial sector and recurring credit gluts.

Indeed, the big banks literally own the Federal Reserve. And they own Washington D.C. politicians, lock stock and barrel. See this, this, this and this.

Two leading IMF officials, the former Vice President of the Dallas Federal Reserve, and the the head of the Federal Reserve Bank of Kansas City, Moody’s chief economist and many others have all said that the United States is controlled by an “oligarchy” or “oligopoly”, and the big banks and giant financial institutions are key players in that oligarchy.

The chairman of the Department of Economics at George Mason University says that it is inaccurate to call politicians prostitutes. Specifically, he says that they are more correct to call them “pimps”, since they are pimping out the American people to the financial giants.

Economics professor Randall Wray writes:

Thieves … took over the whole economy and the political system lock, stock, and barrel.

No wonder the government has saved the big banks at taxpayer expense, chosen the banks over the little guy, and

No wonder crony capitalism has gotten even worse under Obama than under Bush.

No wonder big Wall Street players are continuing to loot taxpayer money and public resources.

No wonder the big banks continue to manipulate every market and commit crime after crime and … and profit handsomely from it, while law-abiding citizens slide further and further behind.

Yet Obama is prosecuting fewer financial crimes than Bush, or his father, or Ronald Reagan.

No wonder:

All of the monetary and economic policy of the last 3 years has helped the wealthiest and penalized everyone else. See this, this and this.

***

Economist Steve Keen says:

“This is the biggest transfer of wealth in history”, as the giant banks have handed their toxic debts from fraudulent activities to the countries and their people.

Stiglitz said in 2009 that Geithner’s toxic asset plan “amounts to robbery of the American people”.

And economist Dean Baker said in 2009 that the true purpose of the bank rescue plans is “a massive redistribution of wealth to the bank shareholders and their top executives”.

Without the government’s creation of the too big to fail banks (they’ve gotten much bigger under Obama), the Fed’s intervention in interest rates and the markets (most of the quantitative easing has occurred under Obama), and government-created moral hazard emboldening casino-style speculation (there’s now more moral hazard than ever before) … things wouldn’t have gotten nearly as bad.

As we wrote in March 2009:

The bailout money is just going to line the pockets of the wealthy, instead of helping to stabilize the economy or even the companies receiving the bailouts:

  • A lot of the bailout money is going to the failing companies’ shareholders
  • Indeed, a leading progressive economist says that the true purpose of the bank rescue plans is “a massive redistribution of wealth to the bank shareholders and their top executives”
  • The Treasury Department encouraged banks to use the bailout money to buy their competitors, and pushed through an amendment to the tax laws which rewards mergers in the banking industry (this has caused a lot of companies to bite off more than they can chew, destabilizing the acquiring companies)

As we pointed out in 2008:

The game of capitalism only continues as long as everyone has some money to play with. If the government and corporations take everyone’s money, the game ends.The fed and Treasury are not giving more chips to those who need them: the American consumer. Instead, they are giving chips to the 800-pound gorillas at the poker table, such as Wall Street investment banks. Indeed, a good chunk of the money used by surviving mammoth players to buy the failing behemoths actually comes from the Fed.

Quantitative Easing

It is well-documented that quantitative easing increases inequality (and see this and this.)

Quantitative easing doesn’t help Main Street or the average American. It only helps big banks, giant corporations, and big investors.

The Federal Reserve has been doing quantitative easing for 5 years … and inequality has shot up over the last 5 years. It’s not a coincidence.

Subsidies to Giant, Wealthy Corporations

Massive subsidies to big corporations is also part of the problem. Indeed, some financial analysts say that the taxpayer subsidy to the giant banks alone is $780 billion per year.

The average American family pays $6,000/year in subsidies to giant corporations.

This is a direct transfer of wealth from the little guy to the big guy … which increases inequality.

Goosing the Stock Market

Moreover, the Fed has more or less admitted that it is putting almost all of its efforts into boosting the stock market.

Robert Reich has noted:

Some cheerleaders say rising stock prices make consumers feel wealthier and therefore readier to spend. But to the extent most Americans have any assets at all their net worth is mostly in their homes, and those homes are still worth less than they were in 2007. The “wealth effect” is relevant mainly to the richest 10 percent of Americans, most of whose net worth is in stocks and bonds.

AP writes:

The recovery has been the weakest and most lopsided of any since the 1930s.After previous recessions, people in all income groups tended to benefit. This time, ordinary Americans are struggling with job insecurity, too much debt and pay raises that haven’t kept up with prices at the grocery store and gas station. The economy’s meager gains are going mostly to the wealthiest.

Workers’ wages and benefits make up 57.5 percent of the economy, an all-time low. Until the mid-2000s, that figure had been remarkably stable — about 64 percent through boom and bust alike.

David Rosenberg points out:

The “labor share of national income has fallen to its lower level in modern history … some recovery it has been – a recovery in which labor’s share of the spoils has declined to unprecedented levels.”

The above-quoted AP article further notes:

Stock market gains go disproportionately to the wealthiest 10 percent of Americans, who own more than 80 percent of outstanding stock, according to an analysis by Edward Wolff, an economist at Bard College.

Indeed, as we reported in 2010:

As of 2007, the bottom 50% of the U.S. population owned only one-half of one percent of all stocks, bonds and mutual funds in the U.S. On the other hand, the top 1% owned owned 50.9%.***

(Of course, the divergence between the wealthiest and the rest has only increased since 2007.)

Professor G. William Domhoff demonstrated that the richest 10% own 98.5% of all financial securities, and that:

The top 10% have 80% to 90% of stocks, bonds, trust funds, and business equity, and over 75% of non-home real estate. Since financial wealth is what counts as far as the control of income-producing assets, we can say that just 10% of the people own the United States of America.

Tyler Durden notes:

In today’s edition of Bloomberg Brief, the firm’s economist Richard Yamarone looks at one of the more unpleasant consequences of Federal monetary policy: the increasing schism in wealth distribution between the wealthiest percentile and everyone else. … “To the extent that Federal Reserve policy is driving equity prices higher, it is also likely widening the gap between the haves and the have-nots….The disparity between the net worth of those on the top rung of the income ladder and those on lower rungs has been growing. According to the latest data from the Federal Reserve’s Survey of Consumer Finances, the total wealth of the top 10 percent income bracket is larger in 2009 than it was in 1995. Those further down have on average barely made any gains. It is likely that data for 2010 and 2011 will reveal an even higher percentage going to the top earners, given recent increases in stocks.” Alas, this is nothing new, and merely confirms speculation that the Fed is arguably the most efficient wealth redistibution, or rather focusing, mechanism available to the status quo. This is best summarized in the chart below comparing net worth by income distribution for various percentiles among the population, based on the Fed’s own data. In short: the richest 20% have gotten richer in the past 14 years, entirely at the expense of everyone else.

***

Lastly, nowhere is the schism more evident, at least in market terms, than in the performance of retail stocks:

Saks chairman Steve Sadove recently remarked, “I’ve been saying for several years now the single biggest determinant of our business overall, is how’s the stock market doing.” Privately-owned Neiman- Marcus reported “In New York City, business at Bergdorf Goodman continues to be extremely strong.”

In contrast, retail giant Wal-Mart talks of its “busiest hours” coming at midnight when food stamps are activated and consumers proceed through the check-outs lines with baby formula, diapers, and other groceries. Wal-Mart has posted a decline in same-store sales for eight consecutive quarters.

As CNN Money pointed out in 2011, “Wal-Mart’s core shoppers are running out of money much faster than a year ago …” This trend has only gotten worse: The wealthy are doing great … but common folks can no longer afford to shop even at Wal-Mart, Sears, JC Penney or other low-price stores.

Durden also notes:

Another indication of the increasing polarity of US society is the disparity among consumer confidence cohorts by income as shown below, and summarized as follows: “The increase in equity prices has raised consumer spirits, particularly among higher-income consumers. The Conference Board’s Consumer Confidence index for all income levels bottomed in February/March of 2009. The recovery since then has been notable across the board, but nowhere as much as for those making $50,000 or more.”

Business Week notes:

Barry Ritholtz, [CIO of Ritholtz Wealth, and popular financial blogger], says millions of potential investors may conclude, as they did after the Great Depression, that the market is a rigged game for insiders. Such seismic shifts in popular sentiment can have lasting effects. The Dow Jones industrial average didn’t regain its September 1929 peak of 355.95 until 1954. “You’re going to lose a generation of investors,” says Ritholtz. “And that’s how you end up with a 25-year bear market. That’s the risk if people start to think there is no economic justice.”

Americans know that the system is rigged against them. See this. We know that the government is giving Wall Street crooks a pass. 70% of Americans know that the government’s economic policies have thrown money at the banks and hosed the people.

In such an environment, the average American has largely gotten out of stocks and other investments.

Over-Financialization

When a country’s finance sector becomes too large finance, inequality rises. As Wikipedia notes:

[Economics professor] Jamie Galbraith argues that countries with larger financial sectors have greater inequality, and the link is not an accident.

Government policy has been encouraging the growth of the financial sector for decades:

https://desultoryheroics.com/wp-content/uploads/2014/03/71000-financialandnonfinancialsectors-compensationlesleopold.jpg

(Economist Steve Keen has also shown that “a sustainable level of bank profits appears to be about 1% of GDP”, and that higher bank profits leads to a ponzi economy and a depression).

Unemployment and Underemployment

A major source of inequality is unemployment, underemployment and low wages.

Corporate Profits v. Jobs

Government policy has created these conditions. And the pretend populist Obama – who talks non-stop about the importance of job-creation – actually doesn’t mind such conditions at all.

The“jobless recovery” that the Bush and Obama governments have engineered is a redistribution of wealth from the little guy to the big boys.

The New York Times notes:

Economists at Northeastern University have found that the current economic recovery in the United States has been unusually skewed in favor of corporate profits and against increased wages for workers.

In their newly released study, the Northeastern economists found that since the recovery began in June 2009 following a deep 18-month recession, “corporate profits captured 88 percent of the growth in real national income while aggregate wages and salaries accounted for only slightly more than 1 percent” of that growth.

The study, “The ‘Jobless and Wageless Recovery’ From the Great Recession of 2007-2009,” said it was “unprecedented” for American workers to receive such a tiny share of national income growth during a recovery.

***

The share of income growth going to employee compensation was far lower than in the four other economic recoveries that have occurred over the last three decades, the study found.

Obama apologists say Obama has created jobs. But the number of people who have given up and dropped out of the labor force has skyrocketed under Obama (and see this).

And the jobs that have been created have been low-wage jobs.

Low Wage Jobs

For example, the New York Times noted in 2011:

The median pay for top executives at 200 big companies last year was $10.8 million. That works out to a 23 percent gain from 2009.

***

Most ordinary Americans aren’t getting raises anywhere close to those of these chief executives. Many aren’t getting raises at all — or even regular paychecks. Unemployment is still stuck at more than 9 percent.

***

“What is of more concern to shareholders is that it looks like C.E.O. pay is recovering faster than company fortunes,” says Paul Hodgson, chief communications officer for GovernanceMetrics International, a ratings and research firm.

According to a report released by GovernanceMetrics in June, the good times for chief executives just keep getting better. Many executives received stock options that were granted in 2008 and 2009, when the stock market was sinking.

Now that the market has recovered from its lows of the financial crisis, many executives are sitting on windfall profits, at least on paper. In addition, cash bonuses for the highest-paid C.E.O.’s are at three times prerecession levels, the report said.

***

The average American worker was taking home $752 a week in late 2010, up a mere 0.5 percent from a year earlier. After inflation, workers were actually making less.

AP pointed out that the average worker is not doing so well:

Unemployment has never been so high — 9.1 percent — this long after any recession since World War II. At the same point after the previous three recessions, unemployment averaged just 6.8 percent.

– The average worker’s hourly wages, after accounting for inflation, were 1.6 percent lower in May than a year earlier. Rising gasoline and food prices have devoured any pay raises for most Americans.

– The jobs that are being created pay less than the ones that vanished in the recession. Higher-paying jobs in the private sector, the ones that pay roughly $19 to $31 an hour, made up 40 percent of the jobs lost from January 2008 to February 2010 but only 27 percent of the jobs created since then.

Alan Greenspan noted:

Large banks, who are doing much better and large corporations, whom you point out and everyone is pointing out, are in excellent shape. The rest of the economy, small business, small banks, and a very significant amount of the labour force, which is in tragic unemployment, long-term unemployment – that is pulling the economy apart.

Money Being Sucked Out of the U.S. Economy … But Big Bucks Are Being Made Abroad

Part of the widening gap is due to the fact that most American companies’ profits are driven by foreign sales and foreign workers. As AP noted in 2010:

Corporate profits are up. Stock prices are up. So why isn’t anyone hiring?

Actually, many American companies are — just maybe not in your town. They’re hiring overseas, where sales are surging and the pipeline of orders is fat.

***

The trend helps explain why unemployment remains high in the United States, edging up to 9.8% last month, even though companies are performing well: All but 4% of the top 500 U.S. corporations reported profits this year, and the stock market is close to its highest point since the 2008 financial meltdown.

But the jobs are going elsewhere. The Economic Policy Institute, a Washington think tank, says American companies have created 1.4 million jobs overseas this year, compared with less than 1 million in the U.S. The additional 1.4 million jobs would have lowered the U.S. unemployment rate to 8.9%, says Robert Scott, the institute’s senior international economist.

“There’s a huge difference between what is good for American companies versus what is good for the American economy,” says Scott.

***

Many of the products being made overseas aren’t coming back to the United States. Demand has grown dramatically this year in emerging markets like India, China and Brazil.

Government policy has accelerated the growing inequality. It has encouraged American companies to move their facilities, resources and paychecks abroad. And some of the biggest companies in America have a negative tax rate … that is, not only do they pay no taxes, but they actually get tax refunds.

And a large percentage of the bailouts went to foreign banks (and see this). And so did a huge portion of the money from quantitative easing. More here and here.

Capital Gains and Dividends

According to a 2013 study published by a researcher at the U.S. Congressional Research Service:

The largest contributor to increasing income inequality…was changes in income from capital gains and dividends.

Business Insider explains:

Drastic income inequality growth in the United States is largely derived from changes in the way the U.S. government taxes income from capital gains and dividends, according to a new study by Thomas Hungerford of the non-partisan Congressional Research Service.

Essentially, what Democrats have been saying about income inequality — that it’s in a large part due to favorable taxation and deduction policies for high income Americans — is largely right

***

The study … conclusively found that the wealthy benefitted from low tax rates on investment income, which in turn caused their wealth to grow faster.

Essentially, taxing capital gains as ordinary income would make the playing field more fair, and reduce over time income inequality.

Joseph Stiglitz noted in 2011:

Lowering tax rates on capital gains, which is how the rich receive a large portion of their income, has given the wealthiest Americans close to a free ride.

Indeed, the Tax Policy center reports that the top 1% took home 71% of all capital gains in 2012.

Ronald Reagan’s budget director, assistant secretary of treasury, and domestic policy director all say that the Bush tax cuts were a huge mistake. See this and this.

Economic Bubbles Take From the Poor, Give to the Rich

sachs-bubbles

At the Economic Populist Blog, Robert Oak posted an excellent analysis of the Pew Research report, A Rise in Wealth for the Wealthy; Declines for the Lower 93%, based on Census data on wealth taken since the so-called economic recovery after 2009. Oak highlighted one of the most important findings of the report:

During the first two years of the nation’s economic recovery, the mean net worth of households in the upper 7% of the wealth distribution rose by an estimated 28%, while the mean net worth of households in the lower 93% dropped by 4%.

In other words, what the report shows is that there was never an economic recovery for most people other than the wealthy 1%. The economic bubble and resultant policies effectively served as a mechanism to transfer wealth from the poor to the wealthy.

According to Michael Snyder at the Economic Collapse blog, it’s extremely likely that we’re about to witness another massive transfer of wealth to the 1% judging from the following 15 signs:

#1 Bob Shiller, one of the winners of this year’s Nobel Prize for economics, says that “bubbles look like this” and that he is “most worried about the boom in the U.S. stock market.”

#2 The total amount of margin debt has risen by 50 percent since January 2012 and it is now at the highest level ever recorded.  The last two times that margin debt skyrocketed like this were just before the bursting of the dotcom bubble in 2000 and just before the financial crisis of 2008.  When this house of cards comes crashing down, things are going to get very messy

“When the tablecloth gets pulled out from under the place settings, you’re going to have a lot of them crash and smash on the floor,” said Uri Landesman, president of Platinum Partners hedge fund. “That margin’s going to get pulled and everyone’s going to have to cover. That’s when you get really serious corrections.”

#3 Since the bottom of the market in 2009, the Dow has jumped 143 percent, the S&P 500 is up 165 percent and the Nasdaq has risen an astounding 213 percent.  This does not reflect economic reality in any way, shape or form.

#4 Market research firm TrimTabs says that the S&P 500 is “very overpriced” right now.

#5 Marc Faber recently told CNBC that “we are in a gigantic speculative bubble”.

#6 In the United States, Google searches for the term “stock bubble” are at the highest level that we have seen since November 2007 – just before the last stock market crash.

#7 Price to earnings ratios are very high right now…

The Dow was trading at 17.8 times the past four quarters of earnings of its 30 components, according to The Wall Street Journal on Friday. That was up from 13.7 times its earnings a year ago. The S&P 500 is trading at 18.7 times earnings. The Nasdaq-100 Index is trading at 21.5 times earnings. At the very least, the ratios are signaling that stock prices are rich.

#8 According to CNBC, Pinterest is currently valued at more than 3 billion dollars even though it has never earned a profit.

#9 Twitter is a seven-year-old company that has never made a profit.  It actually lost 64.6 million dollars last quarter.  But according to the financial markets it is currently worth about 22 billion dollars.

#10 Right now, Facebook is trading at a valuation that is equivalent to approximately 100 years of earnings, and it is currently supposedly worth about 115 billion dollars.

#11 Howard Marks of Oaktree Capital recently stated that he believes that “markets are riskier than at any time since the depths of the 2008/9 crisis”.

#12 As Graham Summers recently noted, retail investors are buying stocks at a level not seen since the peak of the dotcom bubble back in 2000.

#13 David Stockman, a former director of the Office of Management and Budget under President Ronald Reagan, believes that this financial bubble is going to end very badly

“We have a massive bubble everywhere, from Japan, to China, Europe, to the UK.  As a result of this, I think world financial markets are extremely dangerous, unstable, and subject to serious trouble and dislocation in the future.”

#14 Bob Janjuah of Nomura Securities believes that there “could be a 25% to 50% sell off in global stock markets” over the next couple of years.

#15 According to Tyler Durden of Zero Hedge, the U.S. stock market is repeating a pattern that we have seen many times before.  According to him, we are experiencing “a well-defined syndrome of ‘overvalued, overbought, overbullish, rising-yield’ conditions that has appeared exclusively at speculative market peaks – including (exhaustively) 1929, 1972, 1987, 2000, 2007, 2011 (before a market loss of nearly 20% that was truncated by investor faith in a new round of monetary easing), and at three points in 2013: February, May, and today.”

Read the full article here: http://theeconomiccollapseblog.com/archives/15-signs-that-we-are-near-the-peak-of-an-absolutely-massive-stock-market-bubble